This instruction show you guide on how to use eTechnician diagnostic software to view vehicle real-time data.
Related Contents:
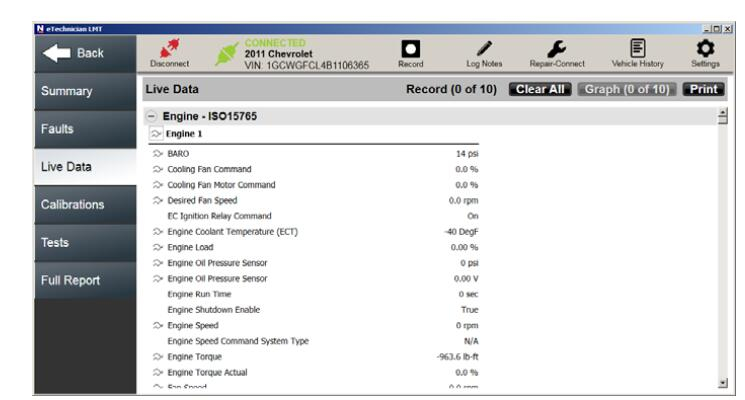
eTechnician™ enables you to view real-time vehicle data (i.e., live data) for any of the available modules. This data—current operating status for parameters and/or sensor information—can provide insight on overall vehicle performance. It can also be used to guide vehicle repair. The parameters are grouped into categories, for example:
• Engine 1
• EGR
• Cylinder Balance
• Turbocharger
• etc.
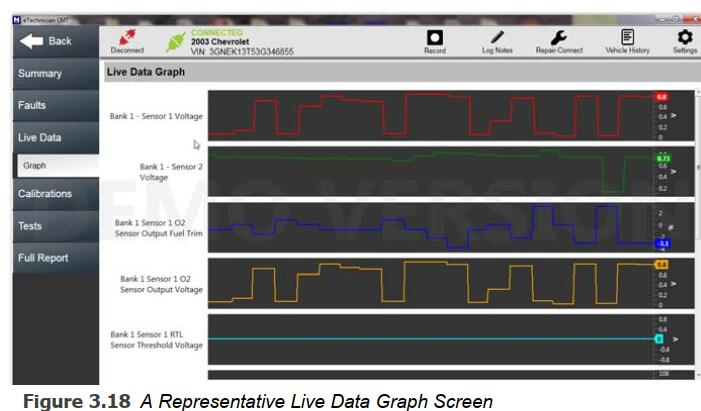
You can select any of the parameters available for graphing, and view a real-time graph of the parameters selected. You may select up to ten (10) parameters to graph, including parameters from multiple categories. The Graph button at the top of the screen keeps track of the number of parameters selected for graphing.
To view vehicle parameters:
1 Click on the Live Data tab on the left side of the display
2 Click the Print button at the top of the screen to send the information to a printer (or save it as a file if you are not connected to a printer).
3 Scroll down the screen to view the complete list of parameters.
Parameters available for graphing have a graphing symbol preceding the name of the parameter in the list.
4 Click on a parameter to select it for graphing (e.g., APP Indicated Angle).
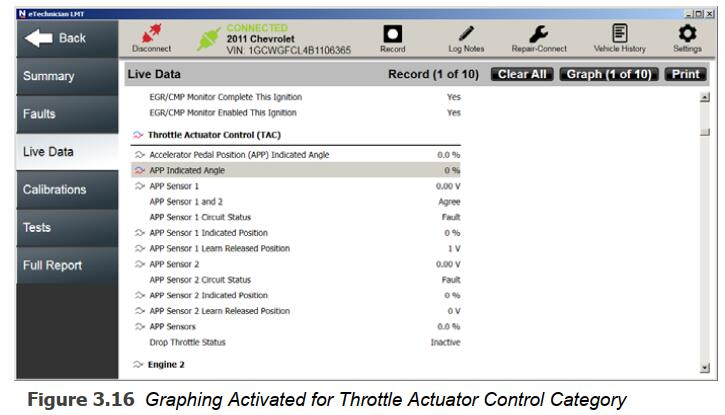
The parameter is highlighted, and the graphing symbol for that parameter changes color .
In addition, the Graph button at the top of the screen indicates how many parameters are selected to graph (e.g., 1 of 10).
NOTE:
i Up to 10 parameters may be graphed at one time. You can also include all the parameters in a single category (up to 10) by clicking on the category name, for example, Cruise Control. To deselect a parameter in a category,just click the parameter name to remove it from the list of parameters you want to graph.
5 Continue to add parameters to your graph until you are ready to view the graph.
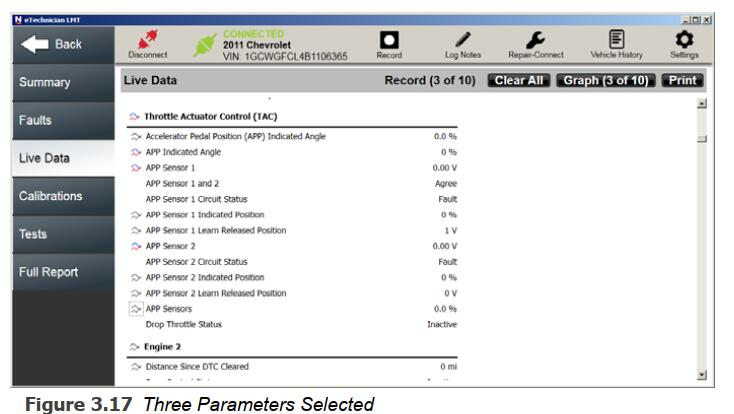
6 Click the Graph button at the top of the screen.
7 Click the Back button to go back to the Live Data screen (Figure 3.17).
8 Click the Clear All button to deselect all parameters available for graphing.
All parameters are deselected.

9 Continue to select additional parameters for graphing.